

World Monitor is an open-source real-time intelligence dashboard. It pulls from 150+ RSS feeds, conflict databases, military flight trackers, vessel AIS streams, satellite fire data, and economic APIs, fusing everything into a single interactive map with 40+ data layers. Built with Vue.js, Deck.gl, and MapLibre GL, it runs on web and desktop, and does ML inference entirely in the browser using ONNX Runtime in Web Workers.
The Problem with Aggregating Everything
Pulling 150+ RSS feeds alongside structured data into a single dashboard creates three coupled problems. Data must stay fresh without triggering rate-limit bans. Signals must be separated from noise. Dozens of heterogeneous data types must render on one interactive map without melting the browser.
These are coupled: the scoring layer feeds directly into the visualization layer, and both depend on a caching strategy that balances staleness against API budgets. Getting any one wrong collapses the value of the other two.
What Gets Ingested
The full feed list spans 150+ RSS entries across all variants and 15 categories plus 17 intelligence sources. Source tiers (wire services at tier 1, major outlets at tier 2, specialized at tier 3, aggregators at tier 4) determine which headline represents a story during clustering.
Wire services and major outlets: Reuters World, AP News, BBC World, Guardian World, CNN World, France 24, Al Jazeera, South China Morning Post, Nikkei Asia
Regional coverage: Kyiv Independent, Meduza, Haaretz, Arab News, Premium Times (Nigeria), Folha de S.Paulo (Brazil), Animal Politico (Mexico), Yonhap News (Korea), VnExpress (Vietnam)
Government and institutional: White House, State Dept, Pentagon, FEMA, Federal Reserve, SEC, CDC, UN News, CISA, IAEA, WHO, UNHCR
Defense and OSINT: Defense One, Breaking Defense, The War Zone, Janes, USNI News, Bellingcat, Oryx OSINT, Krebs on Security
Think tanks: Foreign Affairs, Atlantic Council, CSIS, RAND, Brookings, Carnegie, RUSI, War on the Rocks, Jamestown Foundation
Finance and energy: CNBC, MarketWatch, Financial Times, Yahoo Finance, Reuters Energy, Oil Price / LNG
Feeds are defined with a name and URL, grouped by category on the server:
const gn = (q: string) =>
  `https://news.google.com/rss/search?q=${encodeURIComponent(q)}&hl=en-US&gl=US&ceid=US:en`;

export const VARIANT_FEEDS: Record<string, Record<string, ServerFeed[]>> = {
  full: {
    politics: [
      { name: 'BBC World', url: 'https://feeds.bbci.co.uk/news/world/rss.xml' },
      { name: 'Guardian World', url: 'https://www.theguardian.com/world/rss' },
      { name: 'AP News', url: gn('site:apnews.com') },
      { name: 'Reuters World', url: gn('site:reuters.com world') },
      { name: 'CNN World', url: gn('site:cnn.com world news when:1d') },
    ],
    middleeast: [
      { name: 'BBC Middle East', url: 'https://feeds.bbci.co.uk/news/world/middle_east/rss.xml' },
      { name: 'Al Jazeera', url: 'https://www.aljazeera.com/xml/rss/all.xml' },
      // ... 30+ more feeds across 15 categories
    ],
  },
};
Sources without native RSS (government sites, paywalled outlets, niche OSINT blogs) are ingested through Google News RSS proxies via site-scoped queries with recency filters (when:1d, when:3d). That is the gn() helper above. It works but adds indirection: Google’s index lag means these feeds trail direct RSS by 10-30 minutes.
Beyond RSS, the pipeline pulls from structured APIs:
ACLED: battles, explosions, violence against civilians
UCDP: georeferenced conflict events
GDELT: global event intelligence and protest tracking
NASA FIRMS: satellite fire detection via VIIRS
AISStream: live vessel positions via WebSocket
OpenSky Network: military aircraft positions and callsigns
Cloudflare Radar: internet outage severity by country
FRED / EIA / Finnhub: economic indicators, energy data, market prices
abuse.ch / AlienVault OTX / AbuseIPDB: cyber threat intelligence
HAPI/HDX: humanitarian conflict event counts
Each structured source gets its own cached fetch wrapper. The ACLED client is shared across three endpoints (risk scores, unrest events, raw events) to avoid redundant upstream calls:
const ACLED_API_URL = 'https://acleddata.com/api/acled/read';
const ACLED_CACHE_TTL = 900; // 15 min — matches ACLED rate-limit window

export async function fetchAcledCached(opts: FetchAcledOptions): Promise<AcledRawEvent[]> {
  const token = process.env.ACLED_ACCESS_TOKEN;
  if (!token) return [];

  const cacheKey = `acled:shared:${opts.eventTypes}:${opts.startDate}:${opts.endDate}` +
    `:${opts.country || 'all'}:${opts.limit || 500}`;

  return cachedFetchJson<AcledRawEvent[]>(cacheKey, ACLED_CACHE_TTL, async () => {
    const params = new URLSearchParams({
      event_type: opts.eventTypes,
      event_date: `${opts.startDate}|${opts.endDate}`,
      event_date_where: 'BETWEEN', limit: String(opts.limit || 500),
    });
    // ... fetch with Bearer token auth
  });
}
Each source has its own refresh cadence, auth requirements, and failure modes, which is what makes the caching architecture in the next section necessary.
Pipeline Overview
The system processes data in three stages: ingestion (batching and caching upstream fetches), detection (keyword spike detection plus ML entity classification), and rendering (composite scoring piped into 40+ zoom-gated map layers). These pipeline stages are distinct from the source tiers above; tiers rank credibility, stages describe data flow.
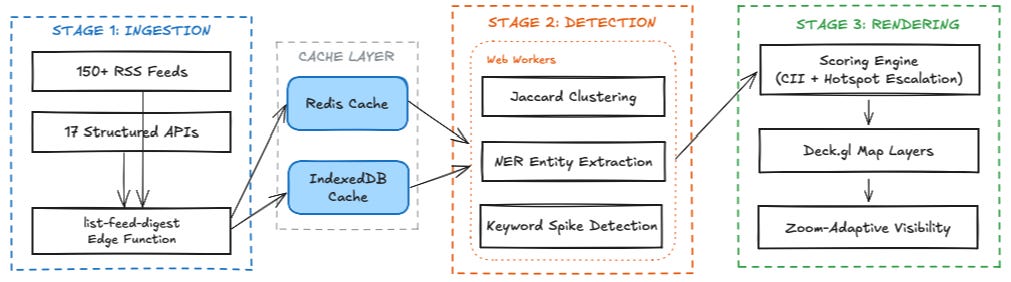
Stage 1: Feed Ingestion and Tiered Caching
The primary ingestion path consolidates all feed fetching into a single edge function that serves every connected client from one cached result.
The list-feed-digest endpoint flattens all feeds for a variant into a single list, then fetches them in batches of 20 with a 25-second hard deadline:
list-feed-digest.ts:20-22 | list-feed-digest.ts:211-253
const BATCH_CONCURRENCY = 20;
const OVERALL_DEADLINE_MS = 25_000;
const FEED_TIMEOUT_MS = 8_000;

const deadlineController = new AbortController();
const deadlineTimeout = setTimeout(() => deadlineController.abort(), OVERALL_DEADLINE_MS);

for (let i = 0; i < allEntries.length; i += BATCH_CONCURRENCY) {
  if (deadlineController.signal.aborted) break;

  const batch = allEntries.slice(i, i + BATCH_CONCURRENCY);
  const settled = await Promise.allSettled(
    batch.map(async ({ category, feed }) => {
      const items = await fetchAndParseRss(feed, variant, deadlineController.signal);
      feedStatuses[feed.name] = items.length > 0 ? 'ok' : 'empty';
      return { category, items };
    }),
  );
}
Individual feeds cache for 600 seconds. The assembled digest caches for 900 seconds. This creates two layers: within 600 seconds, the edge function rebuilds the digest from cached per-feed results without touching upstream. Within 900 seconds, the digest serves directly from Redis without running the edge function at all.
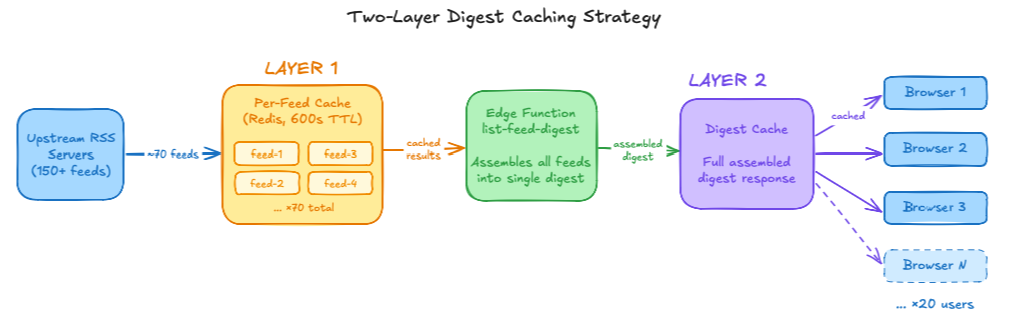
The full news variant includes roughly 70 feeds of the 150+ total feeds across all variants. Without the digest, each browser fires ~70 outbound requests per page load. With it, one edge invocation fetches all feeds, and every subsequent client for the next 15 minutes gets the cached result. For 20 concurrent users, that is 1 invocation instead of 20, each of which would otherwise trigger ~70 upstream fetches. The digest collapses fan-out by roughly 95%.
The edge function marks feeds that timed out as 'timeout' in the response so the client knows which sources are degraded.
Server-side structured APIs follow the same caching pattern. The ACLED conflict API sits behind a shared Redis cache with a 15-minute TTL matching ACLED’s rate-limit window:
const ACLED_CACHE_TTL = 900; // 15 min
const cacheKey = `acled:shared:${opts.eventTypes}:${opts.startDate}:${opts.endDate}:${opts.country || 'all'}:${opts.limit || 500}`;
Three endpoints share this cache. Identical queries hit Redis instead of making redundant upstream calls.
Client-Side Fallback
The client wraps the digest call in a circuit breaker. After two consecutive failures, the breaker opens for 5 minutes:
private digestBreaker = {
  state: 'closed' as 'closed' | 'open' | 'half-open',
  failures: 0,
  cooldownUntil: 0,
};
private readonly perFeedFallbackCategoryFeedLimit = 3;
private readonly perFeedFallbackIntelFeedLimit = 6;
When open, the client first tries a stale cached digest from IndexedDB. If that is expired, it falls back to fetching feeds directly from the browser, limited to 3 feeds per category and 6 intel feeds to keep the fallback lightweight. Feeds are fetched in small sequential batches, with a fixed-size sorted array keeping only the top 20 items per category by publication date:
const batchSize = options.batchSize ?? 5;
const batches = chunkArray(filteredFeeds, batchSize);

for (const batch of batches) {
  const results = await Promise.all(batch.map(fetchFeed));
  results.flat().forEach(insertTopItem);
  options.onBatch?.(ensureSortedDescending());
}
If an individual feed fails twice, it enters a 5-minute cooldown, preventing a single flaky feed from blocking its entire category. Both server and client paths isolate feed failures: the server uses Promise.allSettled, the client wraps per-feed fetches with try/catch.
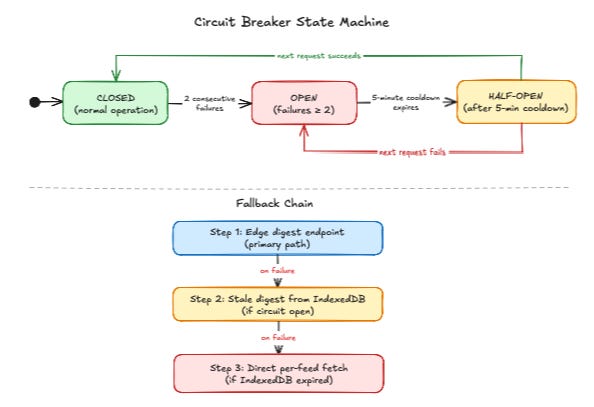
The tradeoff is that the client fallback caches feeds for 30 minutes, so breaking events can lag by up to half an hour during degraded conditions. Tighter TTLs improve freshness but risk rate-limit bans. The server-side digest path (900-second cache) strikes a different balance, trading slightly more staleness for dramatically lower upstream load.
Stage 2: Spike Detection and Entity Filtering
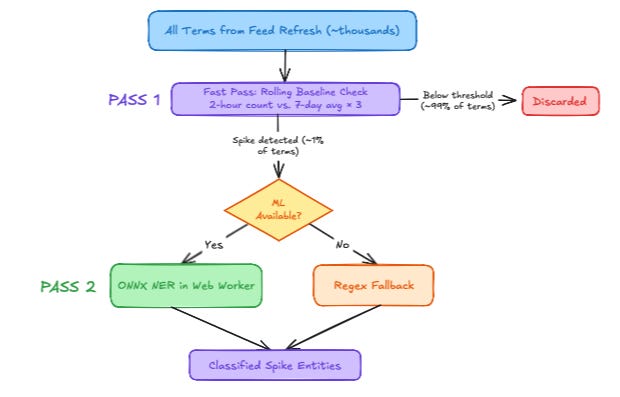
Headlines pass through a two-pass anomaly detection pipeline. The first pass is cheap: count-based keyword spike detection on every refresh. The second pass is expensive: ML-based entity classification only on flagged terms.
The Fast Pass: Rolling Baselines
The trending keywords service tracks term frequency against a 7-day baseline:
trending-keywords.ts:66-69 | trending-keywords.ts:410-412
const ROLLING_WINDOW_MS = 2 * HOUR_MS;      // spike detection window
const BASELINE_WINDOW_MS = 7 * DAY_MS;      // baseline calculation
const SPIKE_COOLDOWN_MS = 30 * 60 * 1000;   // dedup window

// A spike fires when recent count exceeds 3x the 7-day baseline
const isSpike = baseline > 0
  ? recentCount > baseline * config.spikeMultiplier  // default: 3
  : recentCount >= config.minSpikeCount;             // default: 5
A term spikes when its 2-hour count exceeds 3x its 7-day daily average. The 30-minute cooldown prevents repeated firings. A minimum source count of 2 (MIN_SPIKE_SOURCE_COUNT) filters single-source noise.
The fixed 3x multiplier works for high-volume terms but fails on niche topics with no meaningful baseline. When baseline is zero, the code requires at least 5 raw mentions and caps confidence at 0.8:
const confidence = spike.baseline > 0
  ? Math.min(0.95, priorityBoost)
  : Math.min(0.8, 0.45 + spike.count / 20);  // capped for cold-start
Capping cold-start confidence prevents no-baseline terms from outranking established spike signals.
The Heavy Pass: In-Browser NER
Terms that survive the spike check go through ML entity extraction in a Web Worker via @xenova/transformers (ONNX Runtime):
ml.worker.ts:11-12 | ml.worker.ts:236-260
env.allowLocalModels = false;
env.useBrowserCache = true;

async function extractEntities(texts: string[]): Promise<NEREntity[][]> {
  await loadModel('ner');
  const pipe = loadedPipelines.get('ner')!;
  // ... runs ONNX NER model in the browser
}
The model classifies entities as PER, ORG, LOC, or MISC with a 0.75 confidence gate:
trending-keywords.ts:75 | trending-keywords.ts:219
const ML_ENTITY_MIN_CONFIDENCE = 0.75;
if (entity.confidence < ML_ENTITY_MIN_CONFIDENCE) continue;
Entities process in batches of 20 (ML_ENTITY_BATCH_SIZE). Browser-side inference keeps the backend stateless, but model size is constrained to what fits in a Web Worker, and cold-start latency is noticeable while ONNX models download.
When ML is unavailable (cold start, unsupported browser), the system falls back to regex extraction: CVE identifiers, APT/FIN group names, and curated world leader names. This ensures spike detection never stalls waiting for models.
Stage 3: Composite Hotspot Scoring
Spikes and classified entities flow into two parallel scoring systems: a Country Instability Index (CII) and per-hotspot escalation scores. Before those scores can incorporate all available signals, the system needs a way to detect when raw event counts deviate from historical norms. That is where temporal baselines come in.
Temporal Baselines: Welford’s Algorithm
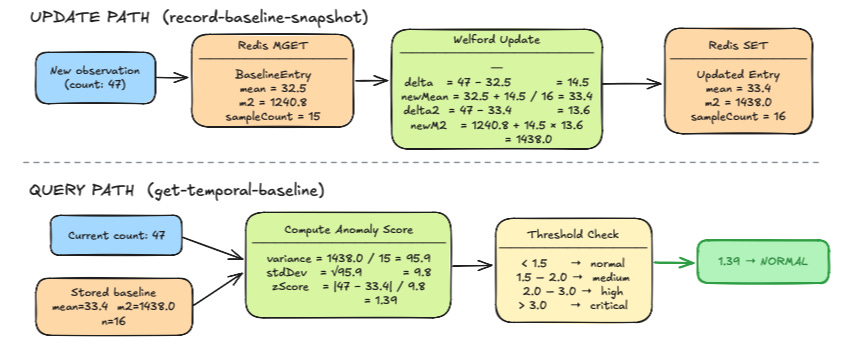
The spike detection in Stage 2 operates on keyword frequencies. A different class of anomaly requires a different approach: detecting when raw event counts deviate from historical norms. Is 47 military flights over the Black Sea unusual for a Tuesday in March?
This requires running statistics per signal type, per region, per day of week, per month. Storing full history is impractical. Instead, the system uses Welford’s online algorithm, which computes exact running mean and variance from constant-size state: mean, m2 (sum of squared differences), sampleCount, and a lastUpdated timestamp.
The Update Path
Each observation passes through recordBaselineSnapshot, which reads the current entry from Redis, applies Welford’s update, and writes back:
record-baseline-snapshot.ts:45-52
const prev: BaselineEntry = existing[i] || { mean: 0, m2: 0, sampleCount: 0, lastUpdated: '' };

// Welford's online algorithm
const n = prev.sampleCount + 1;
const delta = count - prev.mean;
const newMean = prev.mean + delta / n;
const delta2 = count - newMean;
const newM2 = prev.m2 + delta * delta2;
The BaselineEntry stores mean, m2, sampleCount, and a lastUpdated timestamp. Variance reconstructs at query time as m2 / (sampleCount - 1). No raw observations stored. Memory per key is fixed regardless of history length.
Keys segment by four dimensions:
export function makeBaselineKey(type: string, region: string, weekday: number, month: number): string {
  return `baseline:${type}:${region}:${weekday}:${month}`;
}
The type x region x weekday x month structure captures temporal periodicity. Military flight counts over Eastern Europe vary by day of week (training exercises cluster on weekdays) and by season. Without this segmentation, a Tuesday spike would be diluted by weekend lulls, producing false positives.
Six event types are tracked: military_flights, vessels, protests, news, ais_gaps, and satellite_fires. Each stores baselines with a 90-day TTL in Redis (BASELINE_TTL = 7_776_000 seconds).
Updates arrive in batches of up to 20. The handler fetches all existing entries in a single MGET, computes Welford updates, then writes back with parallel individual SET calls:
record-baseline-snapshot.ts:36-64
const keys = batch.map(u => makeBaselineKey(u.type, u.region || 'global', weekday, month));
const existing = await mgetJson(keys) as (BaselineEntry | null)[];

// ... Welford updates per entry ...

await Promise.all(writes);
One MGET round-trip to read all entries, then N parallel SET calls to write back. The reads are batched; the writes fan out but execute concurrently.
The Query Path
To check whether a current count is anomalous, getTemporalBaseline reconstructs variance and computes a z-score:
get-temporal-baseline.ts:54-57
const variance = Math.max(0, baseline.m2 / (baseline.sampleCount - 1));
const stdDev = Math.sqrt(variance);
const zScore = stdDev > 0 ? Math.abs((count - baseline.mean) / stdDev) : 0;
const severity = getBaselineSeverity(zScore);
Three z-score thresholds map to severity levels:
export const Z_THRESHOLD_LOW = 1.5;      // "medium"
export const Z_THRESHOLD_MEDIUM = 2.0;   // "high"
export const Z_THRESHOLD_HIGH = 3.0;     // "critical"
A z-score of 1.5 is roughly a 1-in-15 event under normality; 3.0 is roughly 1-in-370. The distributions are not actually normal (event counts are right-skewed), so these thresholds are pragmatic rather than statistically precise.
The system enforces a learning phase: anomaly detection activates only after 10 samples (MIN_SAMPLES). Before that, the endpoint returns learning: true so the client shows a “building baseline” indicator instead of a misleading “normal” reading. This prevents the first observation from flagging as anomalous against a zero-variance baseline.
The multiplier field (count / mean) gives operators a quick read: 3.2 means “3.2x the historical average for this slot.” When mean is zero but count is positive, the multiplier caps at 999 to avoid division-by-zero artifacts.
Detected anomalies flow directly into the CII as supplemental signals, closing the loop between raw event counts and instability scoring.
Country Instability Index
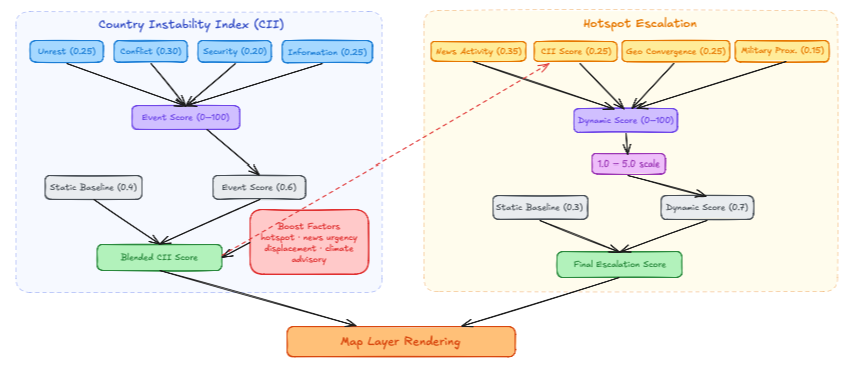
The CII computes a 0-100 score per country from four weighted components:
country-instability.ts:886-904
const eventScore = components.unrest * 0.25
  + components.conflict * 0.30
  + components.security * 0.20
  + components.information * 0.25;

const blendedScore = baselineRisk * 0.4 + eventScore * 0.6
  + hotspotBoost + newsUrgencyBoost + focalBoost
  + displacementBoost + climateBoost
  + getOrefBlendBoost(code, data) + advisoryBoost
  + supplementalSignalBoost;
The 40/60 static-dynamic blend prevents two failure modes. A pure event-driven score drops to zero during quiet periods in countries like Syria, producing false calms. A pure baseline ignores surges entirely. The blend anchors each country with a curated baseline while letting live data dominate.
Each component draws from the structured APIs listed above: protests and internet outages feed unrest, ACLED/UCDP feed conflict, military flights and vessels feed security, news velocity feeds information. The supplementalSignalBoost aggregates AIS disruptions, satellite fire density, cyber threat indicators, and temporal anomaly counts from Welford’s baselines.
High-volume countries (multiplier below 0.7) apply logarithmic scaling to prevent protest-heavy democracies from always scoring high:
country-instability.ts:696-698
const adjustedCount = isHighVolume
  ? Math.log2(protestCount + 1) * multiplier * 5
  : protestCount * multiplier;
Hotspot Escalation
The hotspot engine blends four signals:
const COMPONENT_WEIGHTS = {
  news: 0.35,      // news activity & velocity
  cii: 0.25,       // country instability index
  geo: 0.25,       // geographic convergence of alerts
  military: 0.15,  // military flights/vessels within 200km
};
Raw scores normalize to 0-100, then map to a 1.0-5.0 scale via rawToScore(raw) = 1 + (raw / 100) * 4. The final score blends static baseline with dynamic calculation at 30/70:
function blendScores(staticBaseline: number, dynamicScore: number): number {
  return staticBaseline * 0.3 + dynamicScore * 0.7;
}
Trend direction uses linear regression over a 24-hour sliding window (up to 48 points). Slope above 0.1 means escalating; below -0.1 means de-escalating. Signals fire when scores cross integer thresholds, jump by 0.5+ points, or breach the 4.5 critical level, each with a 2-hour cooldown to prevent alert fatigue.
Military proximity uses Haversine distance within 200km of each hotspot for flights and vessels. Geographic convergence of alerts uses a tighter 150km radius. Vessel AIS data caches for 30 seconds; flight data for 15 minutes. Vessels move slower but their presence near strategic waterways is a stronger signal per unit.
Map Rendering: 40+ Layers Without Melting the Browser
The visualization layer uses Deck.gl 9.2.6 with MapLibre GL 5.16.0. DeckGLMap manages ScatterplotLayers, HeatmapLayers, GeoJsonLayers, PathLayers, IconLayers, TextLayers, PolygonLayers, and ArcLayers across dozens of data types.
Rendering all layers at all zoom levels tanks frame rate. The solution is zoom-gated visibility:
const LAYER_ZOOM_THRESHOLDS = {
  bases: { minZoom: 3, showLabels: 5 },
  nuclear: { minZoom: 3 },
  conflicts: { minZoom: 1, showLabels: 3 },
  economic: { minZoom: 3 },
  natural: { minZoom: 1, showLabels: 2 },
  datacenters: { minZoom: 5 },
  irradiators: { minZoom: 4 },
  spaceports: { minZoom: 3 },
  gulfInvestments: { minZoom: 2, showLabels: 5 },
  // ... additional layer thresholds
};
Conflicts and natural disasters render at zoom 1 (world view) because they matter at any scale. Military bases and nuclear facilities appear at zoom 3 (regional). Data centers wait until zoom 5 (country level). Labels follow the same pattern at higher thresholds.
Supercluster handles marker deconfliction for dense data types (protests, tech HQs, tech events, data centers). Cluster results cache on a composite key of zoom level, bounds, and layer visibility mask. If all three match the previous frame, recalculation is skipped:
if (zoom === this.lastSCZoom
    && boundsKey === this.lastSCBoundsKey
    && layerMask === this.lastSCMask) return;
Layer rebuilds debounce on zoom changes and schedule via requestAnimationFrame, pausing when the tab loses focus. Each layer reads severity from the scoring output, coloring hotspot markers by threat level (red/orange/yellow) and adjusting infrastructure markers between light and dark themes for readability.
Design Choices Worth Questioning
Hand-tuned weights over learned parameters. The CII and hotspot engine use fixed blend ratios found empirically. A model trained on historical escalation data would be better, but that requires labeled datasets the project lacks. Hand-tuned weights are at least legible to operators who need to understand why a score changed.
Browser-side ML. Running NER in a Web Worker costs nothing to operate, but model size is constrained and cold-start latency is noticeable. If spike volume grew substantially, the Worker would bottleneck. Server-side NER removes that ceiling but requires maintaining GPU inference infrastructure.
Fixed z-score thresholds for non-normal distributions. Event counts are right-skewed, not normal. Proper treatment would use a Poisson or negative binomial model. Welford’s was chosen because it gives mean and variance from three numbers per key, while distribution-aware models require shape parameters and maximum-likelihood fits across hundreds of region-weekday-month combinations. The pragmatic thresholds have not missed anomalies in practice; the risk is false positives on low-count signals, partially mitigated by the 10-sample learning phase.
Zoom gating as rendering budget. Hiding layers below certain zoom levels means information loss. A priority-based layer budget that renders highest-severity markers regardless of zoom would recover some of that loss without the full rendering cost.
Major Contributions
WorldMonitor is built and maintained by @koala73 (Elie Habib).
Young man, I’ve learned more from you than I did in a decade as a software engineer. Thank you.